Work in Progress,
Four Complications in Understanding the Evolutionary Process

Volume 18 Number 1 By
Richard C. Lewontin, Alexander Agassiz Research Professor at the Museum of Comparative Zoology, Harvard University.
Taxonomic Space
In order to discuss complications that arise in the understanding of evolutionary processes, it is first necessary to make clear what the evolutionary explanation is to accomplish. For this purpose the concept of "taxonomic space" is a useful one. We owe this notion to G. Evelyn Hutchinson, but Walter Fontana and others have since used it in one form or another. This taxonomic space of organisms has a huge number of dimensions, each corresponding to some character that might be used in the characterization of an individual. If one looks at the occupancy of such a space, one is struck by the fact that it has a structure to it. Individual organisms are clustered in the space and those clusters are themselves clustered. And there are clusters of clusters of clusters, rather like the stars in the cosmos. The most important thing for the evolutionist is that nearly the entire space is empty, not only when extant organisms are considered, but when all organisms known to have ever existed are considered. The measure of the emptiness of that space is nearly one, and the measure of the occupancy is nearly zero.
The real problem for the evolutionist is not to explain the kinds of organisms that have actually ever existed. The real problem for the evolutionist is how it is that most kinds of potential and seemingly reasonable organisms have never existed. The problem is to explain the location of the empty spaces in the clustered assemblage of occupied points. It is easy to describe organisms that have never existed. There are snakes that live in the grass, but there are no grass-eating snakes. Birds perch in trees, yet, aside from a few exceptions, they do not eat all that greenery around them, but rather spend a great deal of energy searching for food. So why are there virtually no leaf-eating birds? The fact that the measure of the unoccupied space is so big compared to the measure of the occupied space, means that explanations of that lack of occupancy are not so easy to come by. That most of the space is empty is expected since the dimensionality is enormous and only a relatively small number of organisms have come into existence since the beginning of life. Since there has only been one history of life, the reason for the low occupancy in the total space is the finiteness of time.
Hierarchical Clumping
the structure of the occupancy is another matter. Organisms are underdispersed in taxonomic space and we need to understand the causes of the hierarchical clumping. One reason for hierarchical clumping in taxonomic space is simply that organisms arise one from another. If an organism is someplace in taxonomic space, it is likely that its immediate descendants will be someplace close by in the space rather than someplace far away. It may not be that a particular region in the space is impossible to fill or that you can't get there from here, but that there has not been enough time for evolution to fill that space.
On the other hand, the structure of accessibility may make it impossible to get there from here without retracing the steps to a remote branch point that led from a distant ancestral state. One remarkable evolutionary example of not being able to get there from here is that no vertebrate has ever succeeded in evolving wings without giving up something. There are no hexapod vertebrates. Bats and birds have had to give up their forelimbs to produce wings. We will never evolve into a race of angels because we do not have the genotype that will allow for the possession of arms, legs, and wings. There is no general structural problem of evolving multiple limbs and multiple wings. Insects have succeeded in evolving six legs and four wings. So the problem for vertebrates is that of not being able to get there from here without retracing the evolution of vertebrates from invertebrates. In the absence of a very large numbers of trials such as we have in the case of the entire collection of vertebrates, we cannot know whether a specific "hole" in the space is a consequence of the structure of accessibility or simply the chance result of a small sample size.
Taxonomic space may be clumped because there are ways of making a living that are so costly or have such a low survivorship and competitive ability in the face of already existing organisms that natural selection has prevented their occurrence except as rare mutational forms. Finally, there are some processes and structures that may simply not work given the general structure of the organisms in which they might occur. Despite the immense variation in methods of locomotion that animals have evolved, there are no organisms that move along the ground on wheels. Presumably this is a consequence of the problem of enervating and supplying nutrients to an axially rotating macroscopic structure.
Four Complications
when we concern ourselves with "innovation" and "novelty" in evolution, we are concerned with the occupation of a region of the taxonomic space that has been previously empty. Unlike Walter Fontana's usage, novelty for the biologist is not the occupancy of a state that is somehow "difficult" to get to, but rather the more intuitive notion of the occupancy of a state that is a surprise, because it has never happened before despite a very large number of trials. Such novelties need not be very distant in the space from already existing forms and they need not be very large unoccupied regions, but may be in taxonomically quite small subspaces, as for example the evolution of a grass-eating snake. It is the pathways of evolution of novelties as I have defined them here that have shown a variety of possibilities that are themselves unexpected and whose occurrence should caution us against making easy model assumptions about what it takes to produce an evolutionary novelty.
Empty Space Doesn't Tell Us Much
 |
| Figure 1a (see Fig1b caption). |
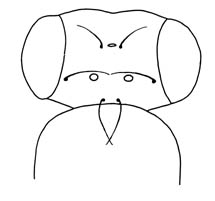
The first fact that we must take into account is that we cannot judge how easy it is to create a novelty from the simple observation that parts of taxonomic space seem to have been avoided by organisms. There is a vast literature produced during the middle of the 20th century showing that there exists within species a large reservoir of standing genetic variation that can be used by selection to move a population to a position in the space that is not only currently unoccupied, but appears to be prohibited by some genetic or developmental constraint. The best-known cases are those in which some aspect of the phenotype is invariant within a species, but variation between individuals can be produced by stressing the development either genetically or environmentally. By selecting among the variants the mean phenotype of the population can be changed and this change is heritable, demonstrating that there was genetic variation relevant to the character in the population but that under normal developmental circumstances this variation was hidden. That is, the development of the phenotype was buffered or "canalized" (Waddington, 1953; Rendel, 1959). Such changes can alter a character that is invariant not only within a species, but over a large taxonomic range, as for example placement of the three simple light receptors (ocelli) and their six associated sensory bristles on the head of all individuals in all species of the genus Drosophila. The ocelli are normally symmetrically placed, one anterior to the left, one to the right, and one posterior on the midline of the head (Figure 1a). Maynard Smith and Sondhi, (1960) succeeded in creating lines with only the posterior ocelli and, more surprisingly, lines in which the majority of individuals were asymmetrical (Figure 1b).
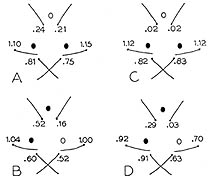 |
| Figure 1b. Ocelli and ocellar bristles in Drosophila. a) Normal pattern; b) result of selection for two ocelli in lines selected only for posterior ocelli (A,C) and for one anterior and one posterior ocellus (B,D). Numbers indicate the mean number of ocellar bristles at each position. (From Maynard Smith and Sondhi, 1960). |
What is less well known is that allometric shape patterns that appear to be the consequence of unbreakable allometric relations that apply over many species of different size can also be changed by genetic variation already present within species. An example is the experiment of Anna Haynes (1989) on wing dimensions in Drosophila. Figure 2 shows two wing vein lengths that are negatively correlated among individuals within all species of Drosophila and between species means of all species in the genus. Haynes selected individuals in Drosophila melanogaster for which both measurements were larger (relative to a control length on the same wing) than the mean and, in another selected line, in which both were smaller than the mean. As a result, in only 15 generations she succeeded in changing the correlation between the measurements from -.4 to +.2, breaking a genus-wide correlation. Such a genus-wide correlation seems an obvious candidate for a basic developmental constraint, yet the experiment shows that it is trivially easy to break using the genetic variation that is already present in the species.
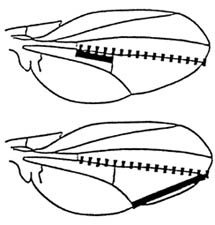 |
| Figure 2. Wing dimensions measured in the experiment of Haynes (1989). Dashed line is the control length. Solid lines are the lengths whose ratio to the control length is used as a basis for selection. |
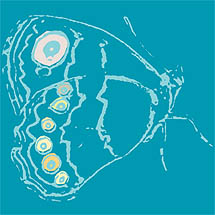
In this case we must conclude that the unoccupied region of the phenotypic space is easily accessible genetically and developmentally, but is empty because of natural selection. The same phenomenon was demonstrated for anterior and posterior eye spots on the wings of the butterfly Bicyclus anynana by Beldade et al. (2002). A strong positive correlation in the size of anterior and posterior eye spot size and other serially repeated features is the rule in butterflies and has been assumed to be a consequence of basic developmental mechanisms of anterio-posterior differentiation. The experiment reversed the correlation within 11 generations of selection. In both cases, despite the universality of the correlations in nature, there was enough genetic variation in growth relations within a population to allow a selective reversal within a few generations of the pattern.
A thorough aerodynamic modeling of the relation between fly size, lift, and wing dimensions in Drosophila might reveal a functional rule for the case of the fruit flies. But, there are other selective reasons besides immediate function that keep regions of the space empty. There is a large literature showing that Drosophila females discriminate in their acceptance of courting males against individuals who deviate from the usual morphology for the species, as for example, deviant eye or body colors. It is this discrimination that prevents mating between species, but it also keeps the morphology of a given species within narrow bounds. It is part of the theoretical commitment of "evo-devo," the study of the evolution of development and the influence of developmental pathways on evolution, that shape is greatly constrained by basic developmental relations resulting from cell-to-cell signalling and gradients in gene transcription that are more or less fixed across a wide range of organisms. That may indeed be true for some features of development, but it is also clear that the observed constancy of some feature is not in itself a demonstration of such genetically determined invariance. At least for wings in flies and moths we must assume that natural selection is playing a stabilizing role in preventing evolutionary change in these organisms that is already possible with the genetic variability that they possess.
Small Changes Lead to Functional Novelties
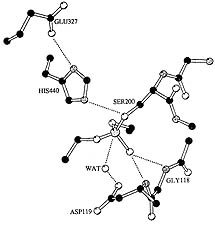 |
| Figure 3. Molecular structure of active site of cholinesterase in Lucilia coprina, showing the water molecule bound at the aspartic acid residue (119) and the phosphate bound to the serine residue (200). (From Newcomb et al., 1997). |
the second complication is that what we judge to be extremely small changes can produce what everyone would agree to be functional novelties. An example is a case in which a biochemical novelty may arise from a single very small molecular change. Newcomb, Campbell et al. (1997) found that the acquisition of organophosphate herbicide resistance in the blowfly, Lucilia coprina, is a consequence of a single amino acid substitution in the active site of a carboxylesterase that abolished that enzyme specificity and converted the enzyme to an organophosphatase. Figure 3 shows the three-dimensional structure of a closely related esterase with essentially the same structure as the carboxyesterase at the active site. The amino acid mutation that changed the function was the substitution of an asparagine residue for a glycine that allows a water molecule to be bound near the site of binding of the organophosphate. The structural change allows the molecule to participate in an attack on the phosphate bond, hydrolyzing it and destroying a molecule of the organophosphate. Thus, the qualitative change in specificity was a consequence of a small change in the angle at which the substituted amino acid was held in the folded molecule. That this change was not an extraordinary event was shown by the discovery of a second, different amino acid substitution that had the same effect. So, small genetic changes may lead to novel adaptive consequences.
Getting There from Here
A third complication in the process of evolutionary change arises from the topology of accessibility of states, the problem of "getting there from here." One of the most illuminating and well-understood cases at the genetic level is Barry Hall's selection of a novel biochemical function in E. coli.
Hall (1978) set about to select E. coli that could use a novel carbon source, lactobionate, for its energy, instead of the usual lactose. For this purpose he used a gene, ebg (extra beta galactosidase) which had a low efficiency for cleaving the galactosidic bond of lactose and could be dispensed with in normal lactose metabolism. The first step in the experiment was to knock out the lac gene that codes for the normal beta-galactosidase, making a strain that required the ebg gene for normal lactose metabolism. Using a mutagen, he succeeded in accumulating mutations of ebg that would allow growth on lactobionate, but the evolutionary path to this state was not direct. He was not able to select directly for the new substrate. First he had to select for a control mutation such that the ebg gene would be transcribed even in the absence of lactose as an inducer of transcription. Next, he had to select for increased activity on lactose. Then these first selected stages had to be followed by a stage of selection for an intermediate substrate, lactulose, and then a strain that could ferment lactulose was successfully selected to grow on lactobionate. Moreover, at each stage there were several strains that possessed the same biochemical phenotype but only some of them could be further selected to the next stage. This result illustrates that the pathway through the space of genotypes from one phenotypic state to another is complex, rather like a maze with many dead ends. Only a restricted subset of all the pathways that lead to the first adaptation are open to the next so that evolution of a novelty may be very difficult to achieve. This suggests one reason for the apparent conservatism of intermediary metabolism.
Differential Fitness
finally, we must consider the way in which differential fitness constrains the occupancy of the taxonomic space. Unfortunately the determination of fitness is a great deal more complicated than is usually supposed. It is easy to say that fitness of a type is its "relative probability of survival and reproduction" but turning that phrase into a coherent measure that can do work in evolutionary explanation is not so easy.
First, it is obvious that the fitness of a type depends on the environment in which the organism lives. But the environment is not independent of the organism. Organisms, by their biology, determine what aspects of the external world are relevant to them and constantly change their environment by their life activities. That means that as a collection of organisms evolves, their environment evolves with them. The evolution of organism and environment may be described by a pair of coupled differential equations in which changes in both organism [d(org)] and environment [d(env)] are functions of both variables:
d(org)/dt = f(org, env)
d(env)/dt = g(org, env)
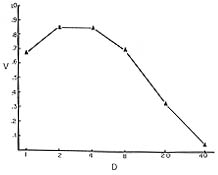 |
| Figure 4. Survival of Drosophila larvae as a function of density. (From Lewontin, 1955). |
A consequence of the codependence of the properties of organisms and their environment is that the Darwinian fitness relations among competing types can be very complex. In particular, the relative fitnesses of genotypes may depend both on the population density of the organisms and on the relative frequency and identity of the competing types. An example of this can be seen in experiments on the effect of population density and composition in Drosophila (Lewontin, 1955; Lewontin and Matsuo, 1963). In these experiments newly hatched Drosophila larvae were placed on a measured amount of an agar medium on which yeast was seeded. An example of a typical result is shown in Figure 4 for an experiment on Drosophila melanogaster where the absolute probability of survival to adulthood of different genotypes was measured at different population densities. The highest probability of survival is not at the lowest density, but at an intermediate density (4-8 per vial). This intermediate optimum is a consequence of the larvae tunneling in the agar, which increases the surface area for yeast growth that is the food of the larvae. The effect can be abolished by making the food so soft that no tunnels are produced. The next step is to mix larvae of different genotypes at various densities to observe the relative probabilities of survival in competition. A typical result is shown in Figure 5 from an experiment on Drosophila busckii. The solid line is the predicted relative survival of two genotypes at different densities, the prediction coming from the absolute survival of the genotypes in pure culture. The dashed and dotted lines are the observed relative survivals in mixed culture at the various densities. What Figure 5 shows is that only at the optimal density (32 per vial for this species) is the actual relative survival predictable from the pure culture survivals. At the non-optimal densities one genotype is superior to the other, and the degree of this superiority depends both on total density and on the relative proportion of the two genotypes. That is, the force of selection is both density and frequency dependent.
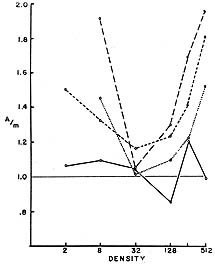 |
| Figure 5. Relative survival of two competing larval genotypes of Drosophila busckii as a function of density and composition. Solid line: predicted relative survival from pure culture experiments of Acme and mutant. Long dashes: observed relative survival in 75% Acme cultures; Short dashes: observed relative survival in 50% Acme cultures; Dots: observed relative survival in 25% Acme cultures. (From Lewontin and Matsuo, 1963). |
The complications that arise from frequency dependence are even greater than those shown in the previous experiment. In experiments involving competition of several genotypes taken two at a time, Dobzhansky (1948) showed lack of transitivity of fitness. That is, genotype A is more fit than genotype B in an experiment involving only these two genotypes, and B is more fit than C in two-way competition, but in three-way competition C beats A. If organisms play a game of scissors-paper-stone in which there is no simple transitivity of differential fitness, then no predictions of the actual outcome or application of game theory that depends on standard utility theory is possible without a detailed mapping of the fitness or utility space.
The difficulties of the concept of fitness are, unfortunately, much deeper than the problem of frequency and density dependence. The problem is that it is not entirely clear what fitness is. Darwin took the metaphorical sense of fitness literally. The natural properties of different types resulted in their differential "fit" into the environment in which they lived. The better the fit to the environment the more likely they were to survive and the greater their rate of reproduction. This differential rate of reproduction would then result in a change of abundance of the different types.
In modern evolutionary theory, however, "fitness" is no longer a characterization of the relation of the organism to the environment that leads to reproductive consequences, but is meant to be a quantitative expression of the differential reproductive schedules themselves. Darwin's sense of fit has been completely bypassed. The natural properties of organisms lead to differential reproductive schedules and these must somehow be mappable onto a quantitative function, fitness that can enter into formal prediction structures. There is also an implication that fitness is a scalar quantity since much of the informal argument of evolutionary theory characterizes one type as "more fit" than another. To make such a scalar work in prediction, a Standard Viability Model of reproduction has been created in which the organisms have discrete generations so that all can be regarded as being born simultaneously and all differences in fitness are the different probabilities of survivorship to sexual maturity.
Any relaxation from the Standard Viability Model produces serious problems in the definition of fitness. If there are differences in fertility and the organisms are sexually reproducing, then fertility, in the general case, is a function of the mating pair. Averaging over different mating combinations will provide a mean fertility of each genotype, but such means are necessarily frequency dependent so the quantitative values will change during the evolutionary process and even the ordering of type fitnesses may shift. The fitness of a genotype can then not be assigned apart from a statement of its frequency in the population and the rules of mating preferences. If we further relax the Standard Viability Model to include all those species with overlapping generations and reproduction that occur over an extended period of the individual's lifetime, then the totality of the reproductive information consists in the age schedule of relative mortality and fertility of different types, embodied in the probability of living from birth to age x, lx, and the number of offspring, bx, produced by an individual of age x in the interval x to x+dx. If the species is sexually reproducing, the vector of age-specific fertilities bx must be substituted by a matrix of the fertilities of couples Bxy of females aged x and males aged y for each genotypic composition of the pair. These are then averaged to produce a matrix of frequency-dependent means for each genotype. These values change not only as frequencies change but as the population changes its age distribution. The attempt by Fisher to circumvent these complications by defining the fitness of a genotype as the root m of the Euler equation did not solve the problem because it confuses the rate of reproduction of a type with the rate of reproduction by a type, which are not at all the same thing in a sexually reproducing species, and also assumes that the population is at the stable age distribution which is not true for a population changing its type frequencies. But the problem is even worse.
It is the case that all the information about the relative reproductive behavior of types in the population is contained in the complete lx and bx schedules of all the genotypes (and, for sexually reproducing species, the age schedule of mating pairs and the frequencies of the different types). Yet this complete reproductive information is insufficient to predict whether a type will increase or decrease in frequency in the population! It is also necessary to know whether the population as a whole is growing larger, is stable in numbers, or is decreasing in numbers. The same type that may be favored in a growing population may be disfavored in a shrinking population. Suppose the only difference between two types is not in their total reproduction but in their age schedule of progeny production. A type that produces offspring at an early age will increase in relative frequency in a growing population because it has reproduced while the total population is still small. If the population is shrinking, however, it pays to postpone reproduction since the total population will then be smaller at the time of reproduction of the tardy type.
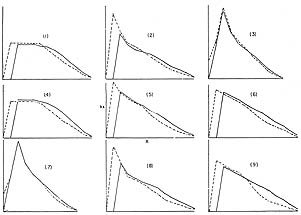 |
| Figure 6. Pairs of contrasting kx schedules for which frequency changes were calculated in populations of increasing and decreasing size. Abscissa: kx, ordinate: age, x. (From Charlesworth and Giesel, 1972). |
Unfortunately, a simple examination of the reproductive schedules does not always reveal that one schedule is obviously "back-loaded" and one "front-loaded" as economists would put it. Figure 6 from the work of Charlesworth and Giesel (1972) shows a number of pairs of hypothetical relative reproductive schedules expressed as kx, the product of lx and bx. In cases 4, 5, 6, and 7, which of the two schedules was favored depended on whether the population was increasing or decreasing in total size. In cases 1, 2, 3, 8, and 9 there was no such contingency. There is no obvious common feature that would have allowed us to predict these classes. How, then, are we to assign relative fitnesses of types based solely on their properties of reproduction? But if we cannot do that, what does it mean to say that a type with one set of natural properties is more reproductively fit than another? This problem has led some theorists to equate fitness with outcome. If a type increases in a population then it is, by definition, more fit. But this suffers from two difficulties. First, it does not distinguish random changes in frequencies in finite populations from changes that are a consequence of different biological properties. Finally, it destroys any use of differential fitness as an explanation of change. It simply affirms that types change in frequency. But we already knew that.
Further Reading
Beldade, P., K. Koops and P.M. Brakefield, 2002, Developmental constraints versus flexibility in morphological evolution. Nature 416 844-847.
Charlesworth, B. and J. T. Giesel, 1972, Selection in populations with overlapping generations, II. Relations between gene frequency and demographic variables. Amer Naturalist 106 388-401.
Dobzhansky, T., 1948, Genetics of natural populations, XVIII. Experiments on chromosomes of D. pseudoobscura from different geographical regions. Genetics 33 588-602.
Hall, B., 1978, Experimental evolution of a new enzymatic function, II. Evolution of multiple functions for EBG enzyme in E. coli. Genetics 89 453-65.
Haynes, A., 1989, On developmental constraints in the Drosophila wing. Ph.D. thesis. Harvard University, Cambridge. 115 pp.
Lewontin, R.C., 1955, The effects of population density and composition on viability in Drosophila melanogaster. Evolution 9 27-41.
Lewontin, R.C. and Y. Matsuo, 1963, Interaction of genotypes determining viability in Drosophila busckii. Proc. Nat. Acad. Sci. U.S. 49 270-27.
Maynard Smith, J. and K.C. Sondhi, 1960, The genetics of a pattern. Genetics 45 1039-1050.
Newcomb, R.D., P.M. Campbell, D.L. Ollis, E. Cheah, R.J. Russell, and J.G. Oakeshott, 1997, A single amino acid substitution converts a carboxylesterase to an organophosphorus hydrolase and confers insecticide resistance on a blowfly. Proc. Nat. Acad. Sci. U.S. 94 7464-7468.
Rendel, J.M., 1959, Canalization of the scute phenotype of Drosophila. Evolution 13 425-439.
Waddington, C.H., 1953, Genetic assimilation of an acquired character. Evolution 7 118-126.
Figure 1 Ocelli and ocellar bristles in Drosophila. a) Normal pattern; b) result of selection for two ocelli in lines selected only for posterior ocelli (A,C) and for one anterior and one posterior ocellus (B,D). Numbers indicate the mean number of ocellar bristles at each position. (From Maynard Smith and Sondhi, 1960).
Figure 2 Wing dimensions measured in the experiment of Haynes (1989). Dashed line is the control length. Solid lines are the lengths whose ratio to the control length is used as a basis for selection.
Figure 3 Molecular structure of active site of cholinesterase in Lucilia coprina, showing the water molecule bound at the aspartic acid residue (119) and the phosphate bound to the serine residue (200). (From Newcomb et al., 1997).
Figure 4 Survival of Drosophila larvae as a function of density. (From Lewontin, 1955).
Figure 5 Relative survival of two competing larval genotypes of Drosophila busckii as a function of density and composition. Solid line: predicted relative survival from pure culture experiments of Acme and mutant. Long dashes: observed relative survival in 75% Acme cultures; Short dashes: observed relative survival in 50% Acme cultures; Dots: observed relative survival in 25% Acme cultures. (From Lewontin and Matsuo, 1963).
Figure 6 Pairs of contrasting kx schedules for which frequency changes were calculated in populations of increasing and decreasing size. Abscissa: kx, ordinate: age, x. (From Charlesworth and Giesel, 1972).
Copied from http://www.santafe.edu/sfi/ publications/ Bulletins/ bulletinWinter03/ inProgress/ complications.html